 US30SIGNALS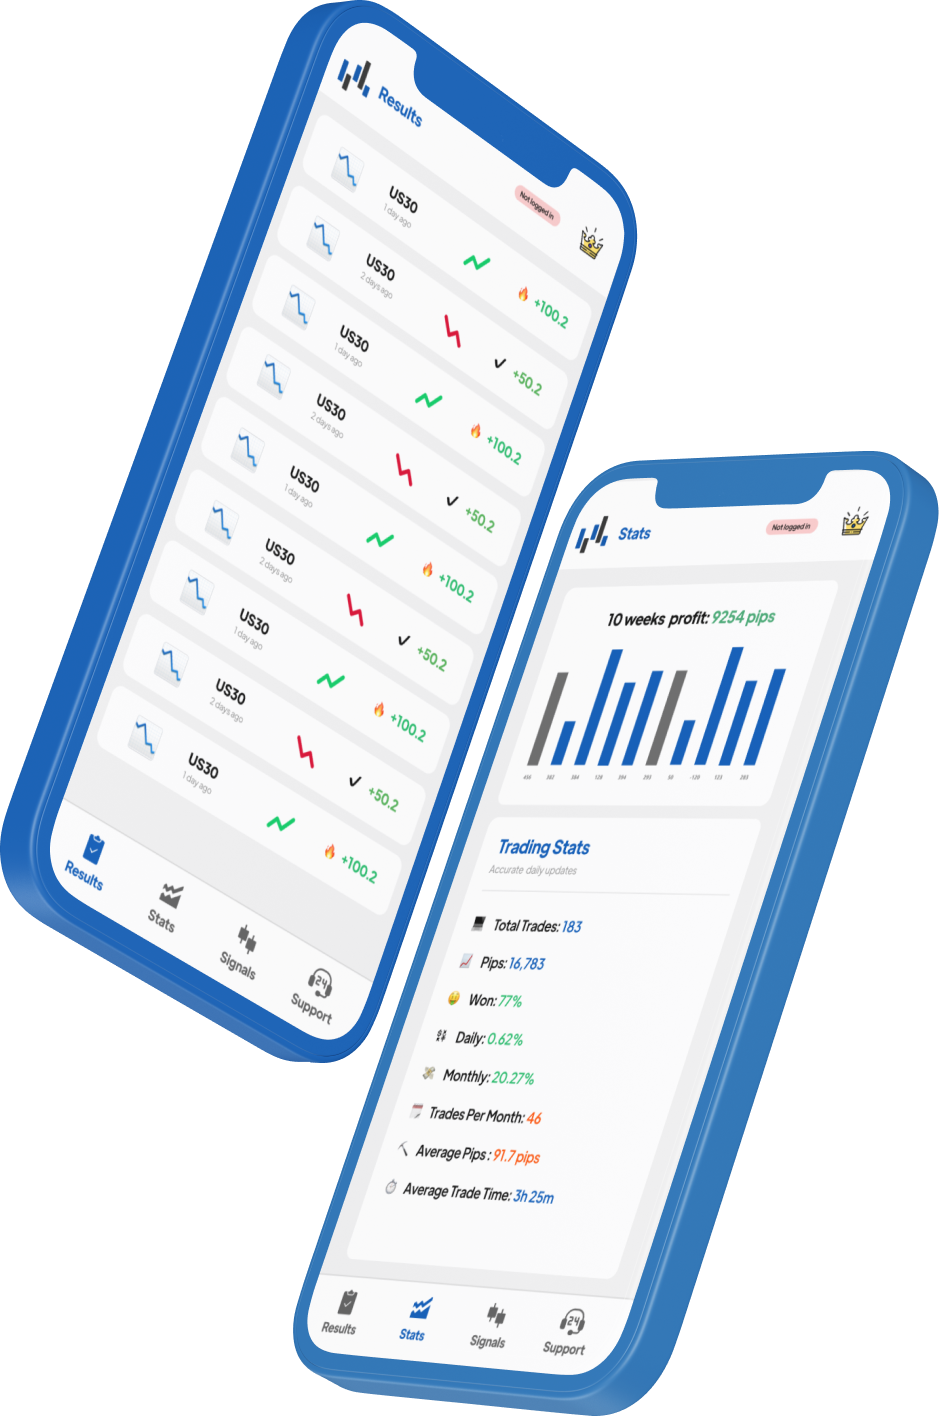
What is US30 trading?
US30 trading explained
The US30 tracks the Dow Jones Industrial Average — 30 major US companies across industrials, financials, healthcare, technology, consumer, and energy sectors. It trades as a CFD or futures-linked product through brokers. Unlike buying individual stocks, you can trade the index in both directions: buy when you expect the Dow to rise, or sell when you expect a pullback.
Why trade the US30?
- Exposure to major US blue-chip companies
- Large daily ranges = high profit potential
- Clear fundamental drivers (Fed policy, earnings, economic data)
- Deep liquidity during US equity hours
- Can be traded with leverage for capital efficiency
- Strong connection to US economic strength and risk sentiment
What moves the US30 price?
Understanding these drivers is essential for anticipating US30 direction.
Fed Policy
The US30 is highly sensitive to Fed rate decisions. Dovish signals can lift the index; hawkish surprises can trigger selloffs.
Corporate Earnings
Dow components move the index through revenue growth, margins, guidance, dividends, and buybacks.
Market Sentiment
Risk-on sentiment fuels the US30. When investors are optimistic about growth, money flows into blue-chip equities.
Treasury Yields
Rising long-term yields can compress equity valuations. Falling 10Y yields are supportive when growth remains stable.
Economic Data
NFP, CPI, GDP, retail sales, and PMI data move the index by shifting growth and Fed-rate expectations.
Industrial Cycle
The Dow is sensitive to manufacturing, transport, energy, and consumer demand because many components are cyclical businesses.
Watch US30 trading in action.
See professional US30 signal execution on US30Signals.
US30 trading strategies.
Trend Following
Identify the higher-timeframe direction and trade with it. Use moving averages (50/200 EMA) for confirmation.
Breakout Trading
Wait for price to break key support/resistance with momentum. Enter on the break, SL below the level.
Range Trading
During consolidation, buy at support and sell at resistance. Works best when volatility is contained and no major data is pending.
News Trading
React to NFP, CPI, FOMC. The US30 can move 200+ points in minutes. Requires fast execution and wider stops.
Signal-Based Trading
Let US30Signals analysts do the analysis. Receive entry/SL/TP, copy into your broker. Best for busy traders.
Scalping
Quick 20-60 point trades on M1-M5 charts around active US equity hours. High frequency, tight risk.
Protect your capital.
Risk management is more important than any strategy. Follow these rules religiously.
Never risk more than 1–2% per trade
If your account is $10,000, risk max $100–$200 per trade. This keeps you in the game through inevitable losing streaks.
Always use a hard stop-loss
No exceptions. Mental stops don't work. Set the SL in your broker before the trade is live. US30Signals provides one on every signal.
Position size from risk, not greed
Calculate your lot size from your stop distance and risk amount. Never pick a lot size first — let the math decide.
Cut losers fast, let winners run
Move SL to breakeven after TP1 hits. Take partials at TP2. Let the rest ride to TP3. Never add to losing positions.
Live US30 levels + signals.
Get auto-calculated support/resistance based on daily pivot points, plus live signals that fire when price approaches these levels. No more watching charts all day.
- → Daily pivot-based S1/S2/R1/R2
- → Signals fire at key levels automatically
- → Session-aware (London/NY overlap prioritised)
- → Lot size pre-calculated for 1% risk
US30 trading questions, answered.
What does the US30 price track? +
US30 commonly labels a broker's CFD linked to the Dow Jones Industrial Average. The index is measured in points. Broker CFDs, the cash index and YM or MYM futures can quote different levels, especially outside the US cash session.
How accurate are US30Signals signals? +
US30Signals maintains a 93% win rate calculated across all closed US30 trades since 2018. This is verified publicly — every signal, win or loss, is timestamped and logged in the app. The average winning trade captures 91.7 points, with an average trade duration of 3 hours 25 minutes. We publish 4–8 signals per trading day.
What does a US30 trading signal include? +
Every US30Signals signal includes: exact entry price or range, stop-loss level, three take-profit targets (TP1, TP2, TP3), suggested position size based on 1% risk, and the trade direction (BUY or SELL). After entry, we send live management updates — SL adjustments, partial close instructions, and "move to breakeven" alerts.
What moves the Dow Jones (US30) price? +
The Dow Jones reflects the share prices of its constituent companies. Company earnings, interest-rate expectations, economic releases and sector developments can change the index. As a price-weighted index, it is constructed differently from the Nasdaq-100.
How much capital do I need to trade US30? +
The amount of capital needed depends on the product, minimum position size, margin requirement and chosen stop distance. Calculate cash exposure from the actual contract specification and account currency. There is no universal starting balance that suits every broker or trading plan.
Which broker should I use for US30/Dow Jones trading? +
Use a broker that supports your exact instrument and account jurisdiction. Compare its contract size, quote currency, spread, execution platform and trading hours. The app provides analysis and alerts; the broker handles trade execution.
What is the best time to trade US30 (Dow Jones)? +
Active periods depend on the instrument, trading venue and economic calendar. London and New York activity often overlap with major releases. Local session times shift relative to UTC during daylight saving, so use the session's named timezone rather than one year-round UTC window.
Is US30 trading risky? +
US30 risk depends on the point move, position size and dollar value per point. Dow futures and broker CFDs have different multipliers, margins and trading sessions; matching the symbol alone does not establish equal cash exposure.
Start trading US30 today.
Download US30Signals free. Professional signals, no experience needed.